The best time frame chart for crypto day trading depends on your trading style and strategy. Here are some common time frames used by day traders:
The time frame chart for crypto day trading on OKX
On OKX, the available time frames—15 minutes, 1 hour, 4 hours, and 1 day—are good for different trading strategies:
- 1. 15-Minute Chart – Best for active day traders looking for quick trades within a few hours. It helps identify short-term trends and entry points.
- 1-Hour Chart – A balanced option for day trading, giving a clearer trend overview while still allowing multiple trades per day.
- 4-Hour Chart – More suited for swing traders but can help day traders understand the broader trend before making decisions.
- 1-Day Chart – Useful for overall market trend analysis but not ideal for day trading.
For day trading on OKX, 15-minute and 1-hour charts are the best choices. You can use:
- 1-hour chart to determine the overall trend.
- 15-minute chart for precise entries and exits.
How to setg up indicators like moving averages or RSI for better analysis?
To improve your crypto day trading analysis on OKX, you can set up key indicators like Moving Averages (MA) and Relative Strength Index (RSI) on the 15-minute and 1-hour charts. Here’s how to do it:
1. Moving Averages (MA) for Trend Confirmation
Moving averages help identify trends and support/resistance levels.
Settings:
- 50-period Exponential Moving Average (EMA) → Short-term trend
- 200-period Exponential Moving Average (EMA) → Long-term trend

How to Use:
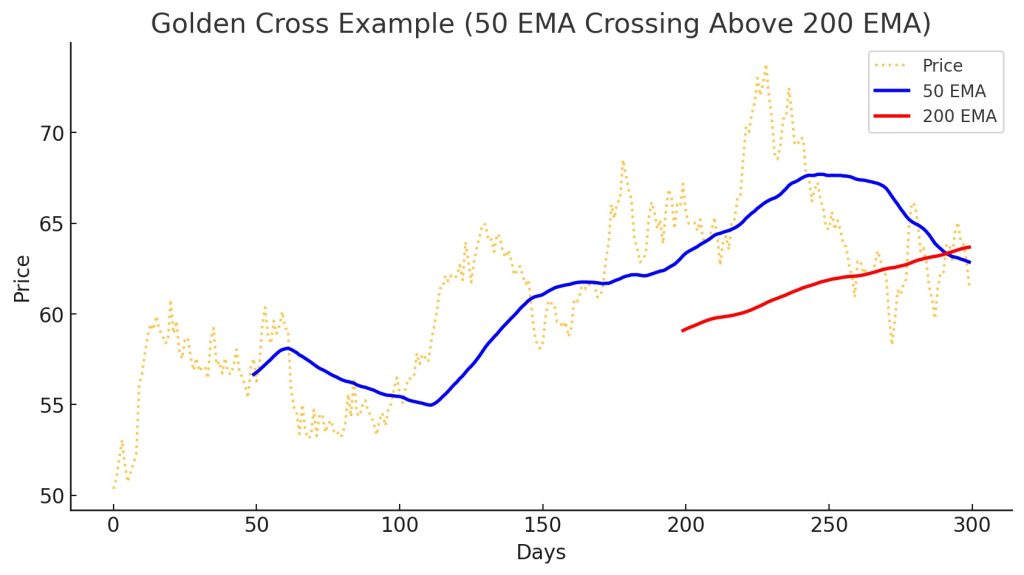
- If the 50 EMA is above the 200 EMA, the trend is bullish (uptrend) → Look for buy opportunities.
- If the 50 EMA is below the 200 EMA, the trend is bearish (downtrend) → Look for sell opportunities.
- When the 50 EMA crosses above the 200 EMA, it’s a bullish signal (Golden Cross).
- When the 50 EMA crosses below the 200 EMA, it’s a bearish signal (Death Cross).

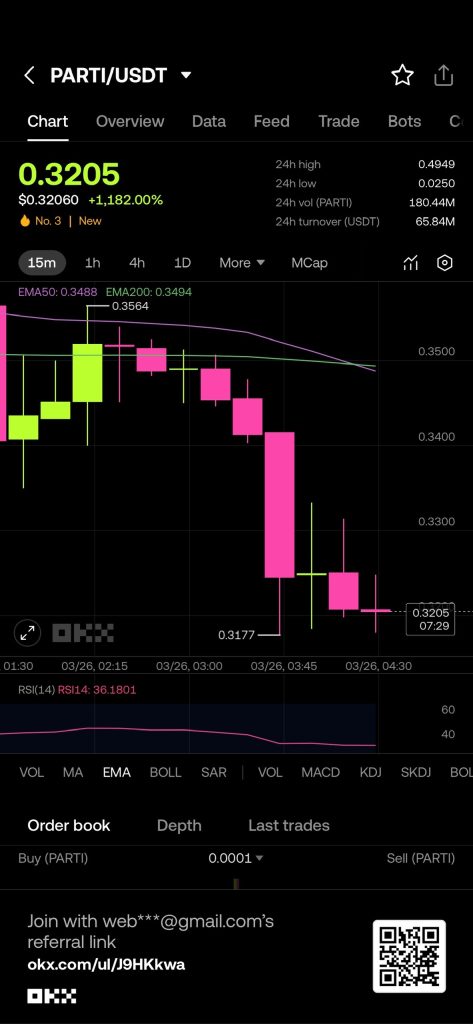
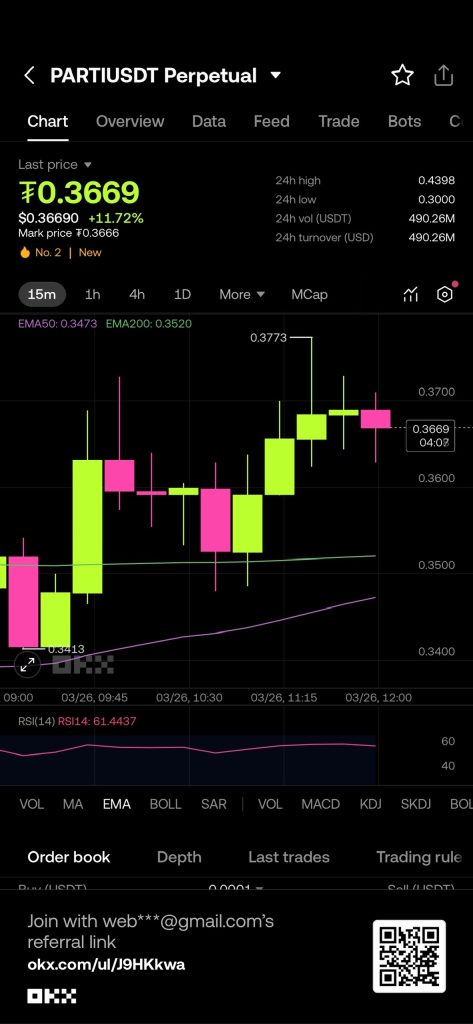
You can see 2 pictures from my screenshot only before and after 15-munites.


2. Relative Strength Index (RSI) for Overbought/Oversold Conditions
RSI measures momentum and helps identify potential reversals.
Settings:
- 14-period RSI
- Levels: 70 (overbought), 30 (oversold)
How to Use:
- Above 70 → Overbought (price may drop) → Consider selling.
- Below 30 → Oversold (price may rise) → Consider buying.
- Divergence:
- If the price makes a higher high, but RSI makes a lower high, it signals a bearish reversal.
- If the price makes a lower low, but RSI makes a higher low, it signals a bullish reversal.
How to Add These Indicators on OKX:
- Open your OKX trading chart.
- Click on Indicators (usually at the top of the chart).
- Search for EMA and add 50 EMA & 200 EMA (choose Exponential Moving Average).
- Search for RSI and add 14-period RSI.
- Adjust colors to differentiate them clearly.
An example trade setup using these indicators
Example Trade Setup Using EMA and RSI on OKX

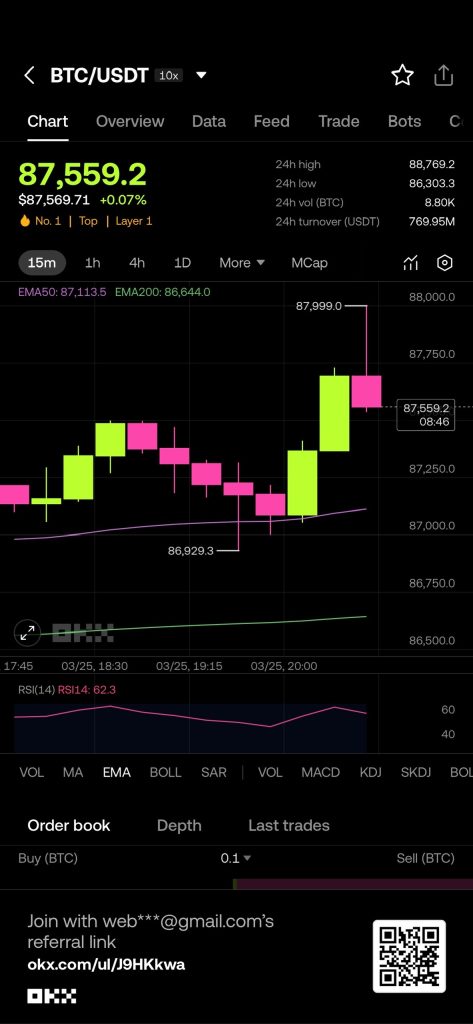
Let’s say you are trading BTC/USDT on the 15-minute chart using:
- 50 EMA (short-term trend)
- 200 EMA (long-term trend)
- RSI (14-period) (momentum indicator)
Bullish Trade Setup (Buy Entry)
Conditions to Enter a Buy Trade:
- 50 EMA crosses above 200 EMA → Bullish trend confirmation (Golden Cross).
- RSI is around 30-40 (oversold zone), showing a possible reversal.
- Price forms a higher low near the 50 EMA (support confirmation).
Entry Point:
- Buy when a bullish candlestick (green) forms above the 50 EMA.
- Confirm that RSI is rising above 40.
Stop Loss (SL):
- Set SL below the recent low (e.g., 0.5%-1% below entry).
Take Profit (TP):
- First TP: When price reaches the last swing high.
- Second TP: If RSI enters overbought (above 70), start closing the trade gradually.
Bearish Trade Setup (Sell Entry)
Conditions to Enter a Sell Trade:
- 50 EMA crosses below 200 EMA → Bearish trend confirmation (Death Cross).
- RSI is around 60-70, signaling overbought conditions.
- Price pulls back and rejects near the 50 EMA resistance.
Entry Point:
- Sell when a bearish candlestick (red) forms below the 50 EMA.
- Confirm that RSI is falling from overbought levels.
Stop Loss (SL):
- Set SL above the recent high (e.g., 0.5%-1% above entry).
Take Profit (TP):
- First TP: When price reaches the last swing low.
- Second TP: If RSI enters oversold (below 30), start closing the trade.
Example Trade on OKX BTC/USDT (15-Minute Chart)
1. Bullish Example:
- 50 EMA crosses above 200 EMA at $65,000.
- RSI is at 35 (oversold).
- Price forms a bullish candle at $65,200 (entry point).
- SL: Below $64,800.
- TP1: At $66,000 (last swing high).
- TP2: If RSI enters overbought, close more positions.
2. Bearish Example:
- 50 EMA crosses below 200 EMA at $64,500.
- RSI is at 65 (overbought).
- Price rejects the 50 EMA at $64,700 (entry point).
- SL: Above $65,000.
- TP1: At $63,800 (last swing low).
- TP2: If RSI reaches 30, close more positions.
This strategy works best when combined with support/resistance levels and candlestick patterns.
See more:


